Float Capital Presents: Backtesting the Flipp3ning market
Simulating a market under Float Capital mechanisms.
Disclaimer: The modelling process below was done ahead of the Alpha launch and so the results will be different to the Alpha Experience
Modelling purpose#
For the Alpha launch, we modelled the evolution of market liquidity under our first market, the Flipp3ning using historical data. This has helped us unlock insights required for fine-tuning the parameters used in the protocol mechanisms.
A useful by-product of this is being able to share the results and insights with the community and future FLT token holders, who will eventually champion the governance of Float Capital DAO.
As one can reasonably expect, the results of the modelling process depend largely on the data as well as the assumptions made - let's talk briefly about them before interpreting the results.
Data#
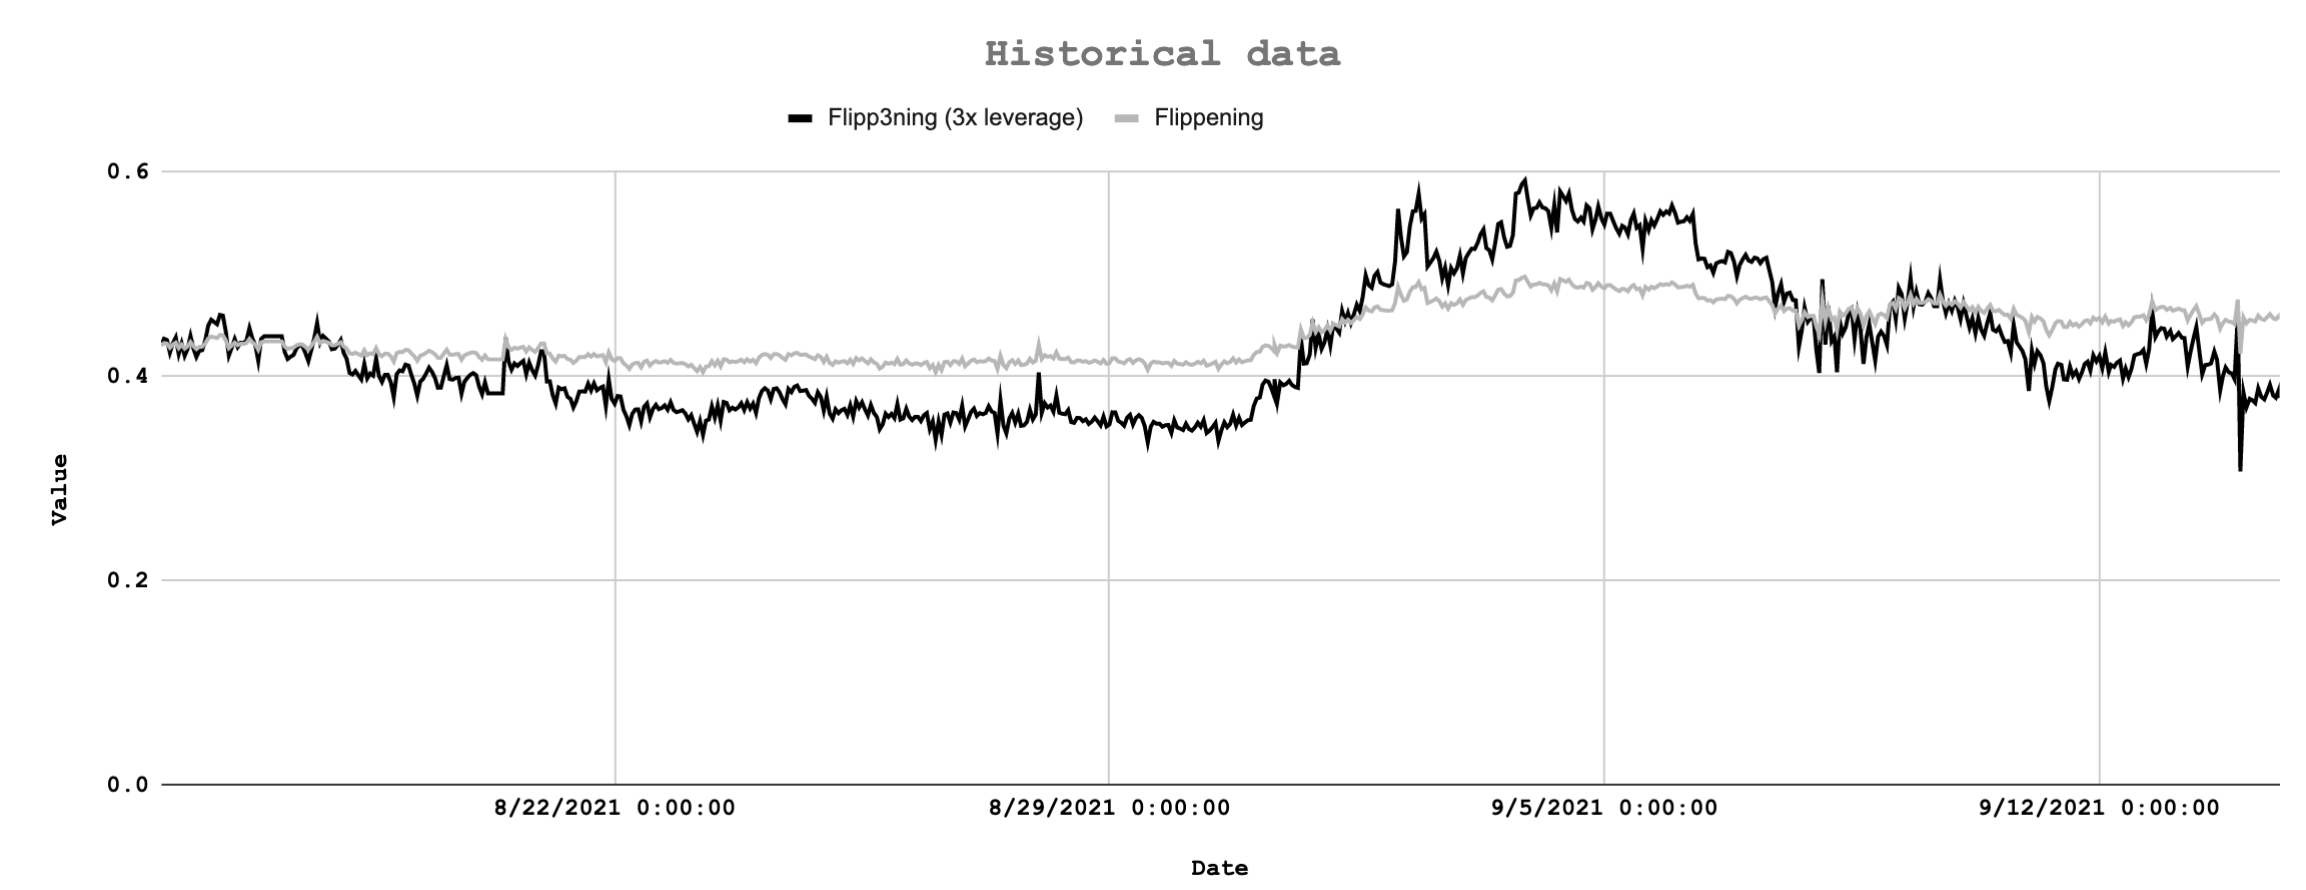
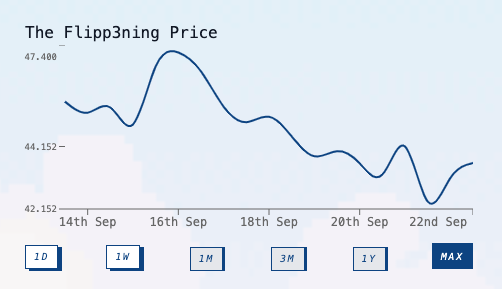
We chose the Flipp3ning as the on-chain asset for modelling, the first market on Float Capital in the Alpha launch. This is a 3x leveraged version of the Flippening, which is calculated as market capitalization of ETH over market capitalization of BTC.
The market movements of ETH and BTC can tend to be quite correlated at times as most outside speculation of crypto does not differentiate between coins, hence the reason for the 3x leverage to increase the volatility of the on-chain asset.
The modelling process runs over 30 days’ worth of data, recorded at an hourly interval; the actual heartbeat (frequency) of price feed in the Alpha and mainnet launch will actually be approximately 5 minutes, so we observed greater volatility in this data than we would observe on the protocol.
Protocol mechanisms#
Float Capital is a peer-to-peer magic internet asset marketplace where each market provides users with the option to take both long and short positions (for more information on Float Capital, click here). Based on the total liquidity on each side (long and short), the one with the less liquidity (the undercapitalized side) will have 100% exposure to price movements and the one with more liquidity (the overcapitalized side) will have exposure equal to the ratio of the undercapitalized side to overcapitalized side (for example, if long has $100 and short has $90, short side will have 100% exposure and long side will have 90/100 = 90% exposure). This floating exposure mechanism ensures that the gains/losses due to price movements are always 100% collateralized in the protocol.
Then you might ask, for a given on-chain asset with a price trajectory, will one side not be greater than the other?
Yes, and hence enter the balancing incentives.
In Float Capital, users who mint positions in the undercapitalized side earn a portion of the yield that is generated by putting the total liquidity locked in the market into AAVE. Users with positions in the overcapitalized side do not receive any portion of the yield. The balance of the yield is sent to the Treasury DAO and will provide price support for FLT tokens that are in circulation (for the Alpha launch, alphaFLT tokens will be issued instead of FLT tokens). This incentivizes the users to balance the markets and hence bring the exposure of the overcapitalized side closer to 100%. This additional yield is calculated using a curve (click here for formula and here for graph). There are further incentives in the form of higher FLT token issuance to users who stake on-chain tokens of the undercapitalized side, but we will cover the fine details of FLT token in another article. In short, the FLT token is a rewards token to incentivise liquidity provision with mechanisms for profit share and price support while also acting as a governance token for the protocol.
Other assumptions#
Given the protocol mechanisms above and the price feeds, we project 2 types of liquidity injections into the system. One is for the initial liquidity that float capital will inject into the system to ensure that the exposure for the users stays as close to 100% for the immediate future (until whales come to play) and the other for the subsequent liquidity that users will inject based on the market movements.
The user liquidity has been further divided into 2 types - performance-based and incentive-based. Performance-based users will assess the recent performance of the on-chain asset in determining whether to enter long or short positions, whereas incentive-based users will assess the excess yield to determine whether to enter long or short positions. The total user liquidity amount is set by multiplying the assumptions for average liquidity per user and the number of users interacting with the protocol.
An initial liquidity of $50,000 was split 50:50 between long and short sides and a total user liquidity of $150 was assumed per time interval.
Results and insights#
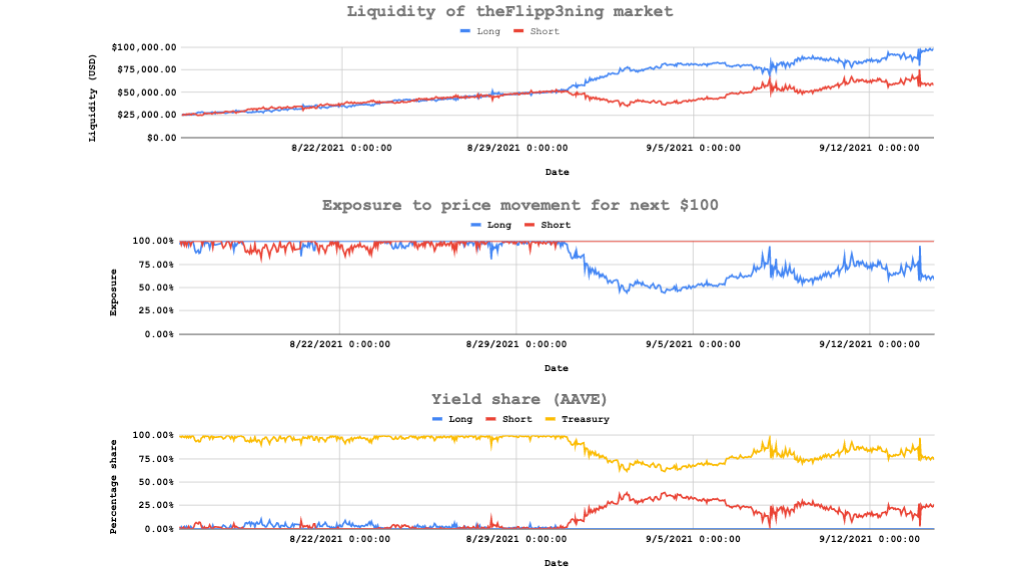
50:50 split between performance-based and incentive-based users#
The liquidity on either side remains relatively balanced until the half-way point, as no significant fluctuations of the historical data are observed and the incentive-based users are injecting liquidity to capture the additional incentive and thereby balance the two sides.
Given the large upswing of the Flipp3ning around the half-way point, we observe that the long liquidity starts becoming significantly overcapitalized due to a couple of reasons:
- Increase in price of the Flipp3ning transfers liquidity from short to long side.
- Upward trend of the Flipp3ning triggers performance-based users to mint long, who are hoping to capture future gains.
At this point, exposure for the long liquidity starts decreasing significantly and the yield share for the undercapitalized (short) side starts increasing from 0, to incentivize users to mint positions in the short side.
20:80 split between performance-based and incentive-based users#
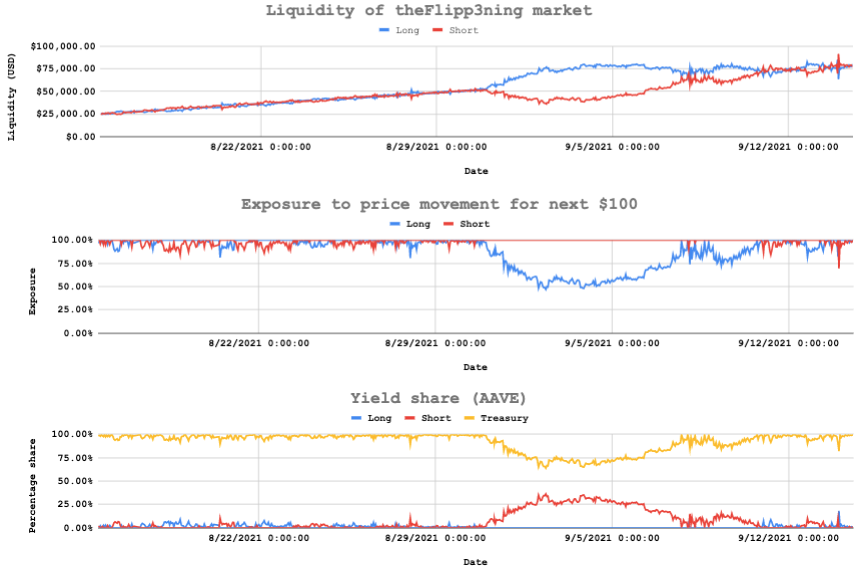
Here we observe a greater tendency towards a balanced market, as a larger portion of users are assumed to inject liquidity to capture the balancing incentives in the protocol.
The benefit of the markets being balanced come in a direct and indirect forms - exposure of the undercapitalized side remains as close to 100% as possible and majority of the yield share is accrued to the Treasury DAO which will provide a price support to FLT tokens issued to users.
The actual percentage of users who inject liquidity into the undercapitalized side will be determined by the relative gain of the balancing incentives to the possibility of impermanent loss in reality.
80:20 split between performance-based and incentive-based users#
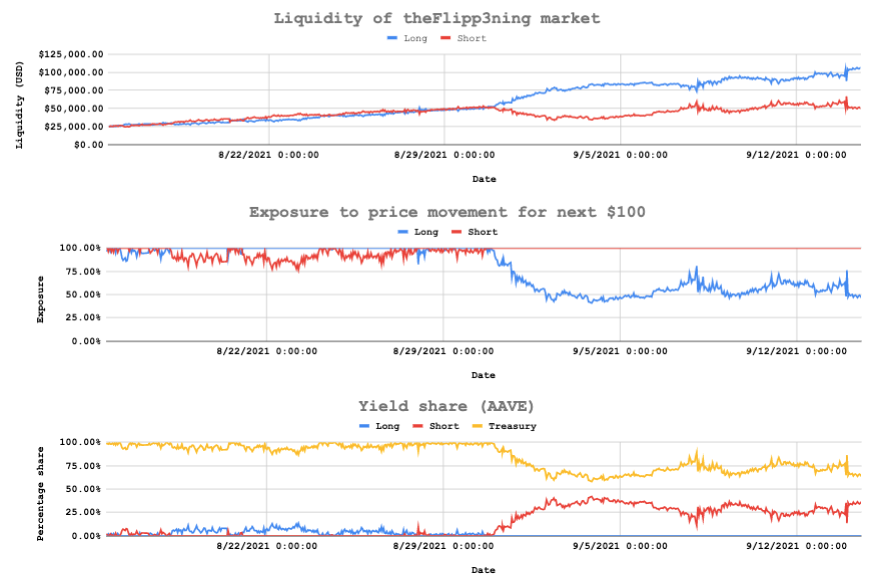
A higher percentage of performance-based users will lead to greater divergence from an equilibrium between long and short sides, and this will amplify the balancing incentives for incentive-based users.
An interesting observation is that the exposure curve for 20:80 split and 80:20 split scenarios take on a similar shape around the half-way point when the Flipp3ning experiences a large gain over a short period. If total liquidity in the market is considerably larger than the assumed user liquidity injections, any up/down swings of price will drown out user liquidity injections.
One thing to note is that the modelling process does not consider the higher FLT token issuance for the users who stake on the undercapitalized side yet, which may in practice result in higher rate of reversion towards an equilibrium between short and long liquidity.
Observation of the Alpha experience#
A massive positive is that we can compare the expected experience from the modelling to the Alpha experience!

Straight off the bat, the major difference to the model was that the initial liquidity from Float Capital was $20,000, with $10,000 in long and short at the launch.
But more importanly, only after 6 days since launch, we are sitting with TVL of $160,000+ in the protocol (one of few instances where I'm happy to be wrong about my assumptions).
And the balance between long and short? Drum roll please....
Long side has 100% exposure and short side has 98.73% exposure!
Even though the short side has been DOMINATING since the launch, the balancing incentives have really outdone themselves in balancing the market.
These observations give us some powerful learnings, which can be fed into the next iteration of the modelling:
- Predicting liquidity injection into the protocol is difficult, so the best solution may be run Monte Carlo simulations across different liquidity injection levels.
- The unmodelled incentive of FLT tokens (alphaFLT in the Alpha) may have a significant influence in incentivizing markets to be balanced.
- The overall balancing incentives seem to be really strong, so we may need to assume a higher proportion of incentive-based users.
This piece was researched and written by Woo Sung Dong with data support from Denham Preen and Jon Jon Clark, and editing support from Jason Smythe and Campbell Easton.
Learn more#
If you want to learn even more about Float Capital, you can visit the docs section of our website.
If you want breaking news, memes and announcements, follow us on Twitter.
If you want to join the community, meet the team and get involved in the future of Float Capital, join our Discord.